
Nested / Feature / Analytics
Feature · Analytics

See the whole business
From real documents across every department

Data from sales, purchasing, inventory, accounting and finance comes together in 27 dashboard reports built on Microsoft Power BI. Filter by branch and Cost Center, drill down to the source document, and export to Excel instantly.

27 dashboards, 6 categories Built on Microsoft Power BI System-wide search with 40+ criteria
Everything analytics needs

Company-wide dataAll on one page

No more waiting for accounting to close the period or gathering reports from several departments.

27 dashboard reports in 6 categories

Mission, Analytic, Accounting, Stock, Forecast and Search, built on Microsoft Power BI, cover everything from documents awaiting approval to the financial statements. No need to pull reports together from multiple files yourself.

Cash flow forecasts from real documents

Past months show actual cash, while upcoming months are projected from sales orders and invoices plus each customer's credit terms, with color coding that separates items not yet due from those past due.

Cash conversion cycle, 3 metrics

Receivable days, payable days and stock days tell you whether collections are slowing, payments are going out too early, or goods are sitting in stock longer. Drill down by customer and by product.

Budget versus actual, by project

Compare the budget you set against actual spend by Cost Center, and filter to review the over-budget items first. Every report can also be filtered by company, branch and period.

System-wide search with 40+ criteria

Search documents across the whole system from one place instead of going menu by menu: date range, branch, salesperson, business partner, amount, status, Cost Center, GL account code and notes.

View it anywhere on mobile

Open key dashboards and reports on iPad tablets, Android and iOS phones, and laptops, with device-specific user guides.

One connected flow

From every department's data
Toward faster decisions

Every number on the dashboard traces back to its source document. No more pulling figures together from multiple Excel files.

Daily documents from every department

Sales, purchasing, inventory, accounting and finance all flow into the same database.

Power BI processes on a schedule

Metrics for every report are calculated for you. No formulas to build yourself.

Choose a report and filter the view

Filter by company, branch, Cost Center and the period you need

Drill down & export to Excel

Click through to the source records behind a number, then export to Excel instantly.

See it in action

Receivable daysKnow right away if collections are slowing

See sales, share of total sales, outstanding balance and days overdue for every customer.
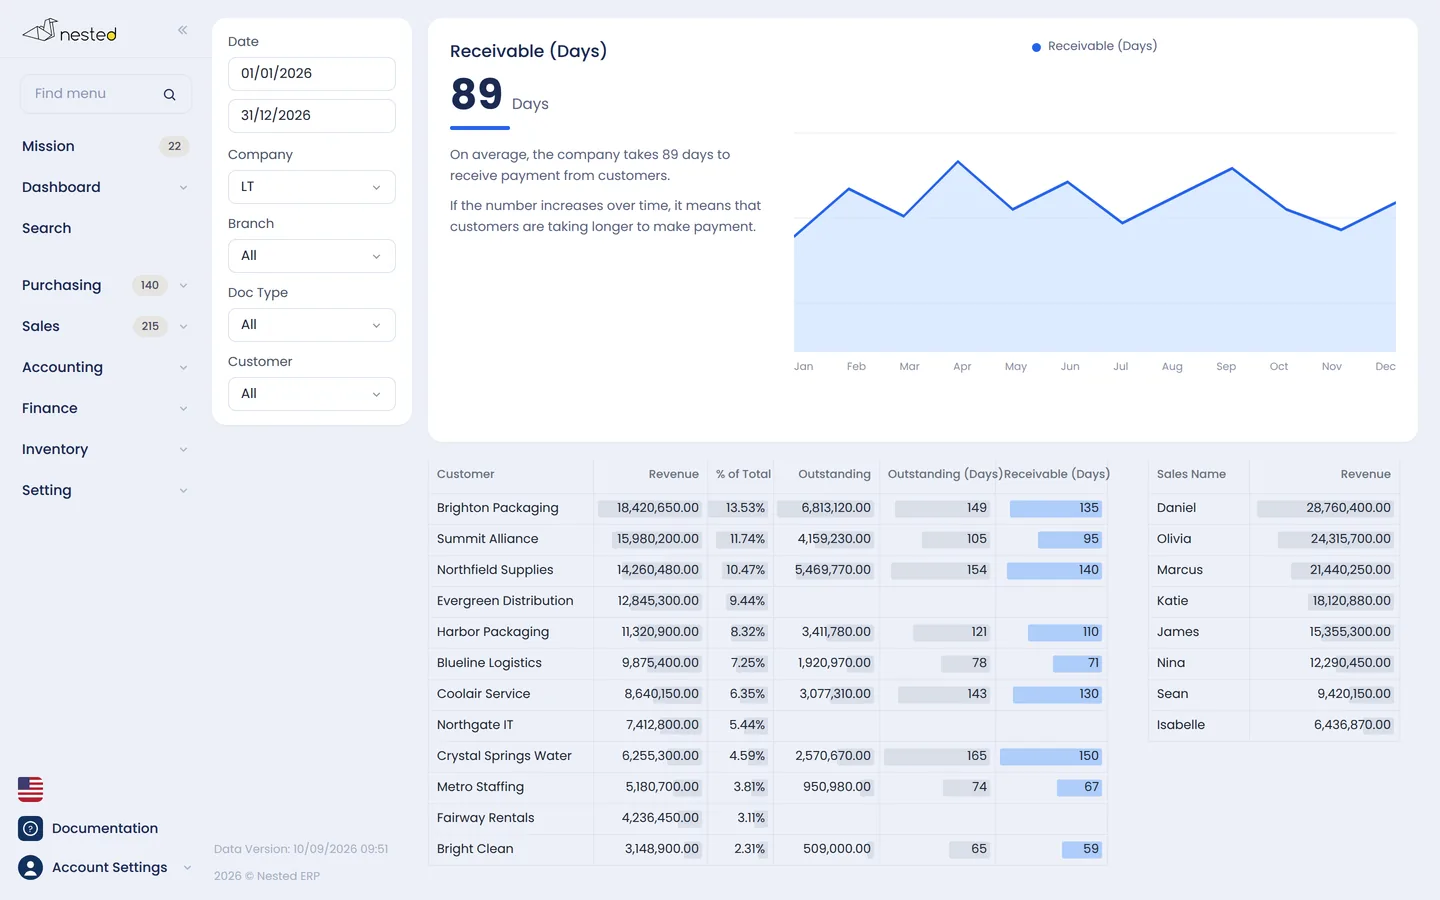
The AR aging report in Nested, split into 0–30, 31–60, 61–90 and over 90 days overdue
Common questions

Frequently asked questions aboutAnalytics features

Do the dashboards really update in real time?
It depends on the report. Bank account balances are shown in real time, accounting reports update about 1 hour after a document is saved or edited, and the system-wide search refreshes roughly every 20 minutes. All of it is still far faster than waiting for the month-end close.
Can I filter to a single branch or project?
Yes, every report. Filter by company, branch, Cost Center and the period you need, switch the view between monthly, quarterly or yearly, and click any chart or table to drill into the details behind a line item.
Can I control budgets by project?
Yes. Set budgets tied to a Cost Center such as a branch, a department or the sales order number of a project, then compare budget against actual spend and filter to review only the Cost Centers that are over budget first.
Can I view reports on mobile?
Yes. It works on iPad tablets via Safari, on Android and iOS phones, and on laptops via Chrome or Edge, with device-specific user guides available in the Help Center.
Documentation

User guideReports and dashboardsIn detail

The real steps, screen by screen, along with the questions customers ask us most. Read it now, no sign-up required

See everything at Dashboard guide

Free consultation

Want to try the analytics features
Get free advice from our team

Talk with our CPA team to see how well Nested's analytics fit your business. Free of charge.

LINE QR code
LScan to add on LINE